Impact Zones Report
Location: Reports > Business Analysis Reports
The Impact Zones Report highlights key performance metrics to help you understand and grow your business. By analyzing worker performance and client behavior, this report provides insight into opportunities for improvement and growth. This report can also be exported or printed at any time.
How to Generate the Report:
- Enter a Begin Date
- Enter an End Date
- Click Generate
Sorting Options 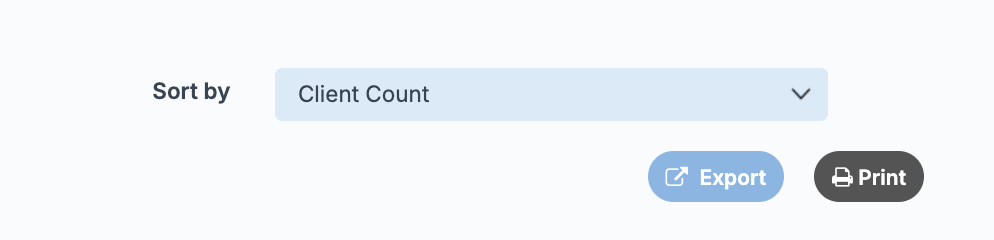
You can sort the report to quickly identify top performers:
- Sort by Worker Name → Displays results in alphabetical order (by first name)
- Sort by Client Count → Displays results in descending order
- Sort by Average Retail Unit → Displays results in descending order
- Sort by Average Service Dollar → Displays results in descending order (highest dollar amount first)
- Sort by Frequency of Visits → Displays results from highest to lowest percentage

Only tickets with a client name attached are calculated in this report.
Table Breakdown
Each row represents an individual worker based on the selected date range:
- Worker → Displays the worker’s first and last name
- Only workers with service or retail sales during the selected date range will appear
- Client Count → The number of clients with a completed ticket by the worker
- Average Retail Unit → The average number of product units sold per client
- Average Service Dollar → The worker’s total service revenue divided by their client count within the selected date range
- Frequency of Visits → The percentage of clients (from Client Count) who have 3 or more future appointments currently booked
 Important Note: Refunded tickets with a client name attached within the selected date range may cause a worker to appear on this report, even if they had no other qualifying sales. In these cases, the worker will display with $0 values.
Related Articles
Inspire Consultant Reporting
Consultant Reporting General Inspire by STX is used by many businesses that take their reporting and consulting very seriously. Often times the businesses using our software are affiliated with well known consulting firms that look at specific key ...Refund Report
Location: Reports > Transaction Reports The Refund Report provides a detailed view of all refunded tickets, including information on whether products were restocked or if refunds were deducted from a worker’s compensation. This report can be exported ...Large Report Generation
When the following reports are selected to be generated for longer than one month, the software will require the report to be scheduled: Total Sheet Sales Analysis Report Text Count Report The report can be scheduled to run ASAP or you can have it ...How do I schedule a report?
This feature will be available in May 2024. Scheduling Reports is available on the following reports: Total Sheet Sales Analysis Report Text Count Report Yearly Dashboard Tab On Hand Product To schedule a report, go to one of the reports listed and ...Inspire by STX Basic Package Details
Inspire by STX Basic Package Details The Inspire by STX Basic package is a great option with many features. Click here to discover all the features included in the Inspire by STX Basic package. The features listed below are exclusive to our Enhanced ...