Be Inspired Report

The details below were included with our Inspire by STX v4.3 update in Summer 2025
The Be Inspired Report is designed to track performance, measure growth, and help set and achieve goals using key performance indicators (KPIs). It can be viewed at both the Company or Worker level and supports both weekly and monthly comparisons, and can be printed at any time for review or record keeping.
How to Generate the Report
- Select Report By: Company or Worker
- Choose a Timeline:
- Quarterly by Week
- Monthly by Year
- Select Week Of or Month Of to define the timeframe
- Click Generate
Level Up Tab
The Level Up tab allows you to track performance against goals and growth targets for the selected timeframe.
KPI Views
You can view the following KPI values based on the selected Year or Quarter:
- Best Week/Month – Displays the highest KPI value recorded within the selected Year or Quarter
- Average Week/Month – Displays the average KPI value for the selected Year or Quarter
- Current Week/Month – Displays the KPI value for the current selected week or month within the Year or Quarter
Target & Level Up Fields
- Target – Set a personal goal for performance
- Use Last Target to copy your most recent entry
- Level Up – Set the required goal to reach the next level
- Use Last Level Up to copy your previous entry
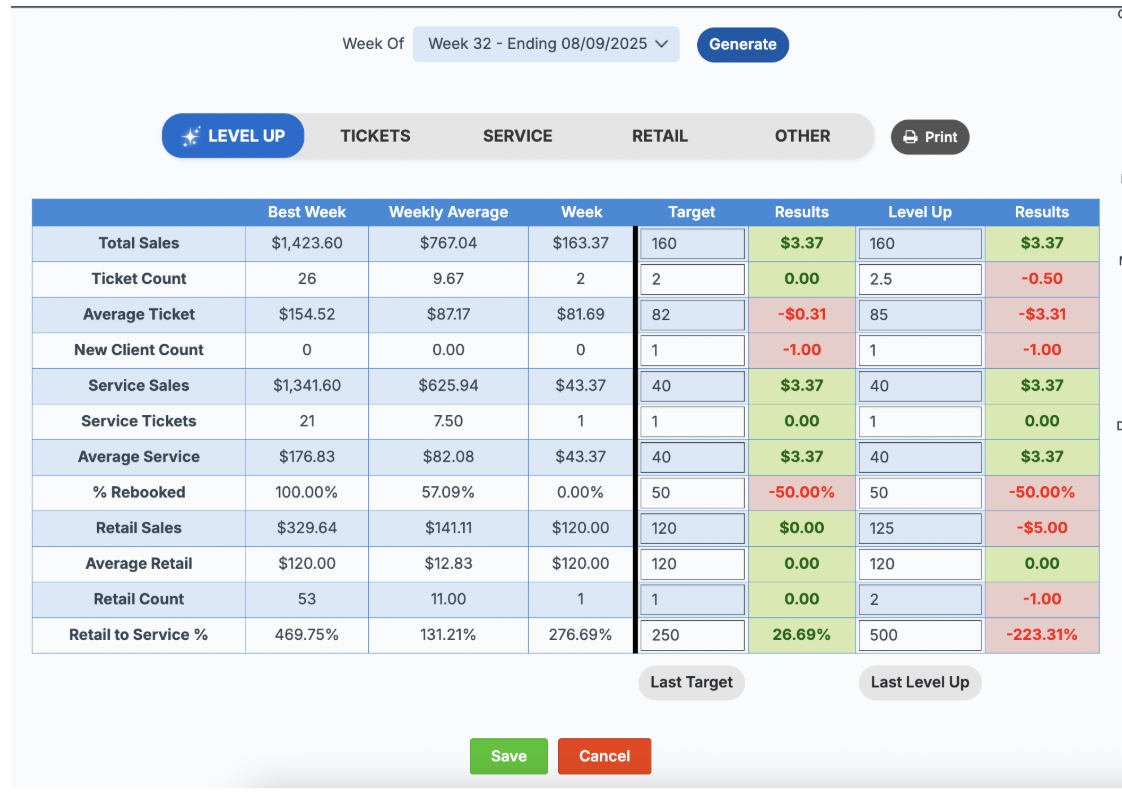 Color Indicators:
- 🔴 Red = Below goal
- 🟢 Green = Exceeded goal
🔴 Red = Below goal
🟢 Green = Exceeded goal

Target & Level Up Example: Worker Joan is a Level 2 Stylist and has been averaging $985 in Service Sales. Her personal goal is to do $1000 in Service Sales but for her to become a Level 3 Stylist - she needs her Service Sales to be $1200.
TARGET = $1000 - LEVEL UP = $1200
View Options & Calculations
Quarterly by Week
- Total Value – Displays the KPI total for the selected week
- Compared to Last Week – Shows the dollar difference from the previous week
- Example: $100 this week vs. $90 last week = +$10
- Compared to Last Week % – Shows the percentage change
- Example: ($100 - $90) ÷ $100 = +10%
Monthly by Year
- Total Value – Displays the KPI total for the selected month
- Compared to Last Year – Shows the dollar difference compared to the same month in the previous year
- Compared to Last Year % – Shows the percentage change
- Example: ($1100 - $1000) ÷ $1000 = +10%
Important Note: If Deduct Guest Charges from Goals & Dashboard is enabled in Setup Goals, guest charges will not be included in worker totals.
Report Tabs Breakdown
Tickets Tab
- Ticket Total – Total ticket value (excluding NCP values and tax)
- Ticket Count – Total number of tickets
- Average Ticket – Ticket Total ÷ Ticket Count
- New Client Tickets – Total number of new client tickets
 A Total row will appear at the bottom of each column to summarize the results.
Service Tab 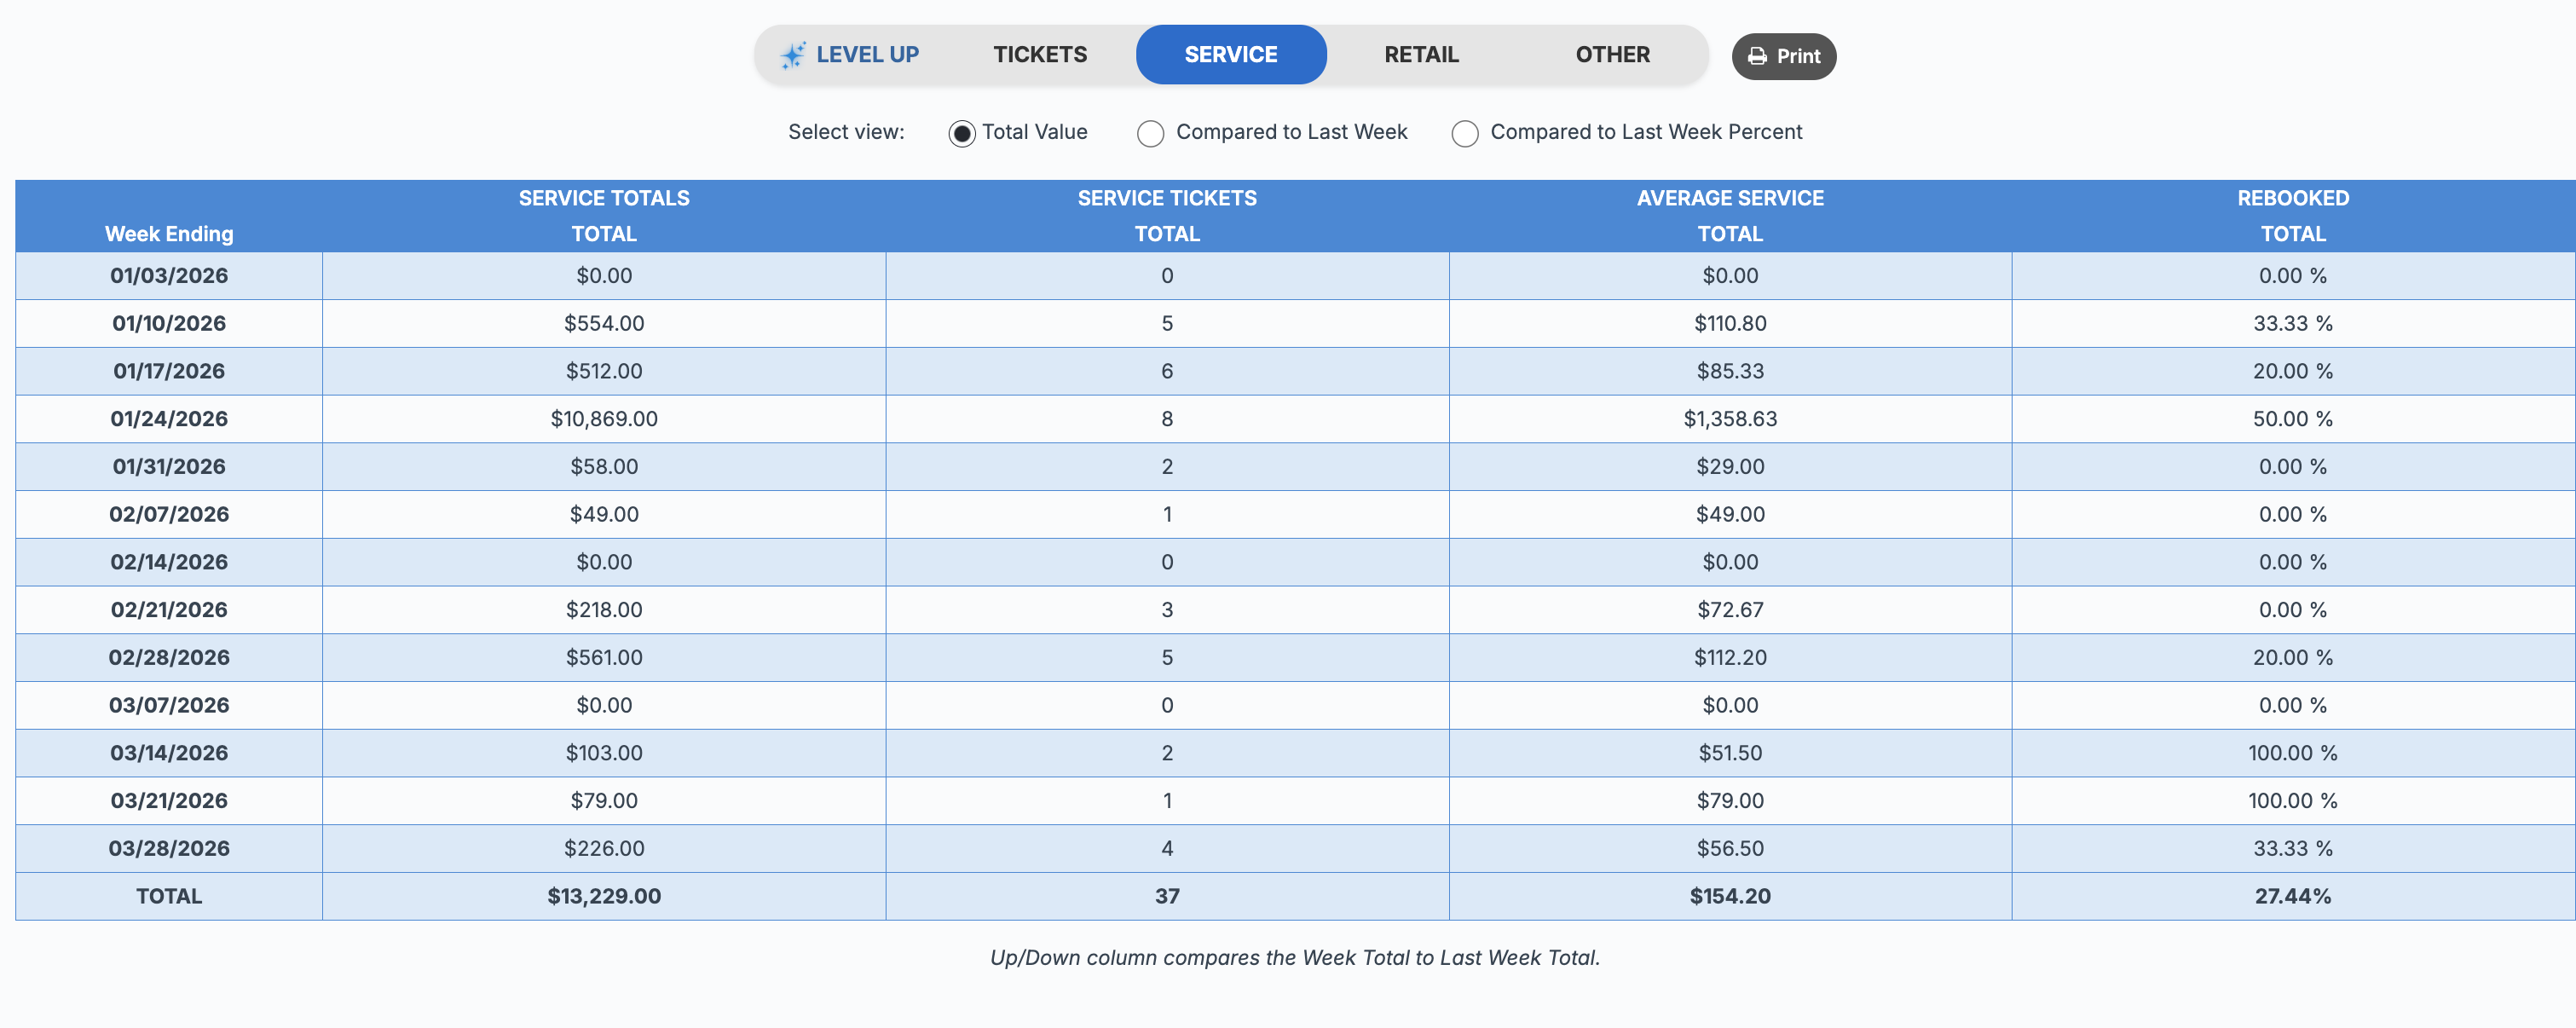
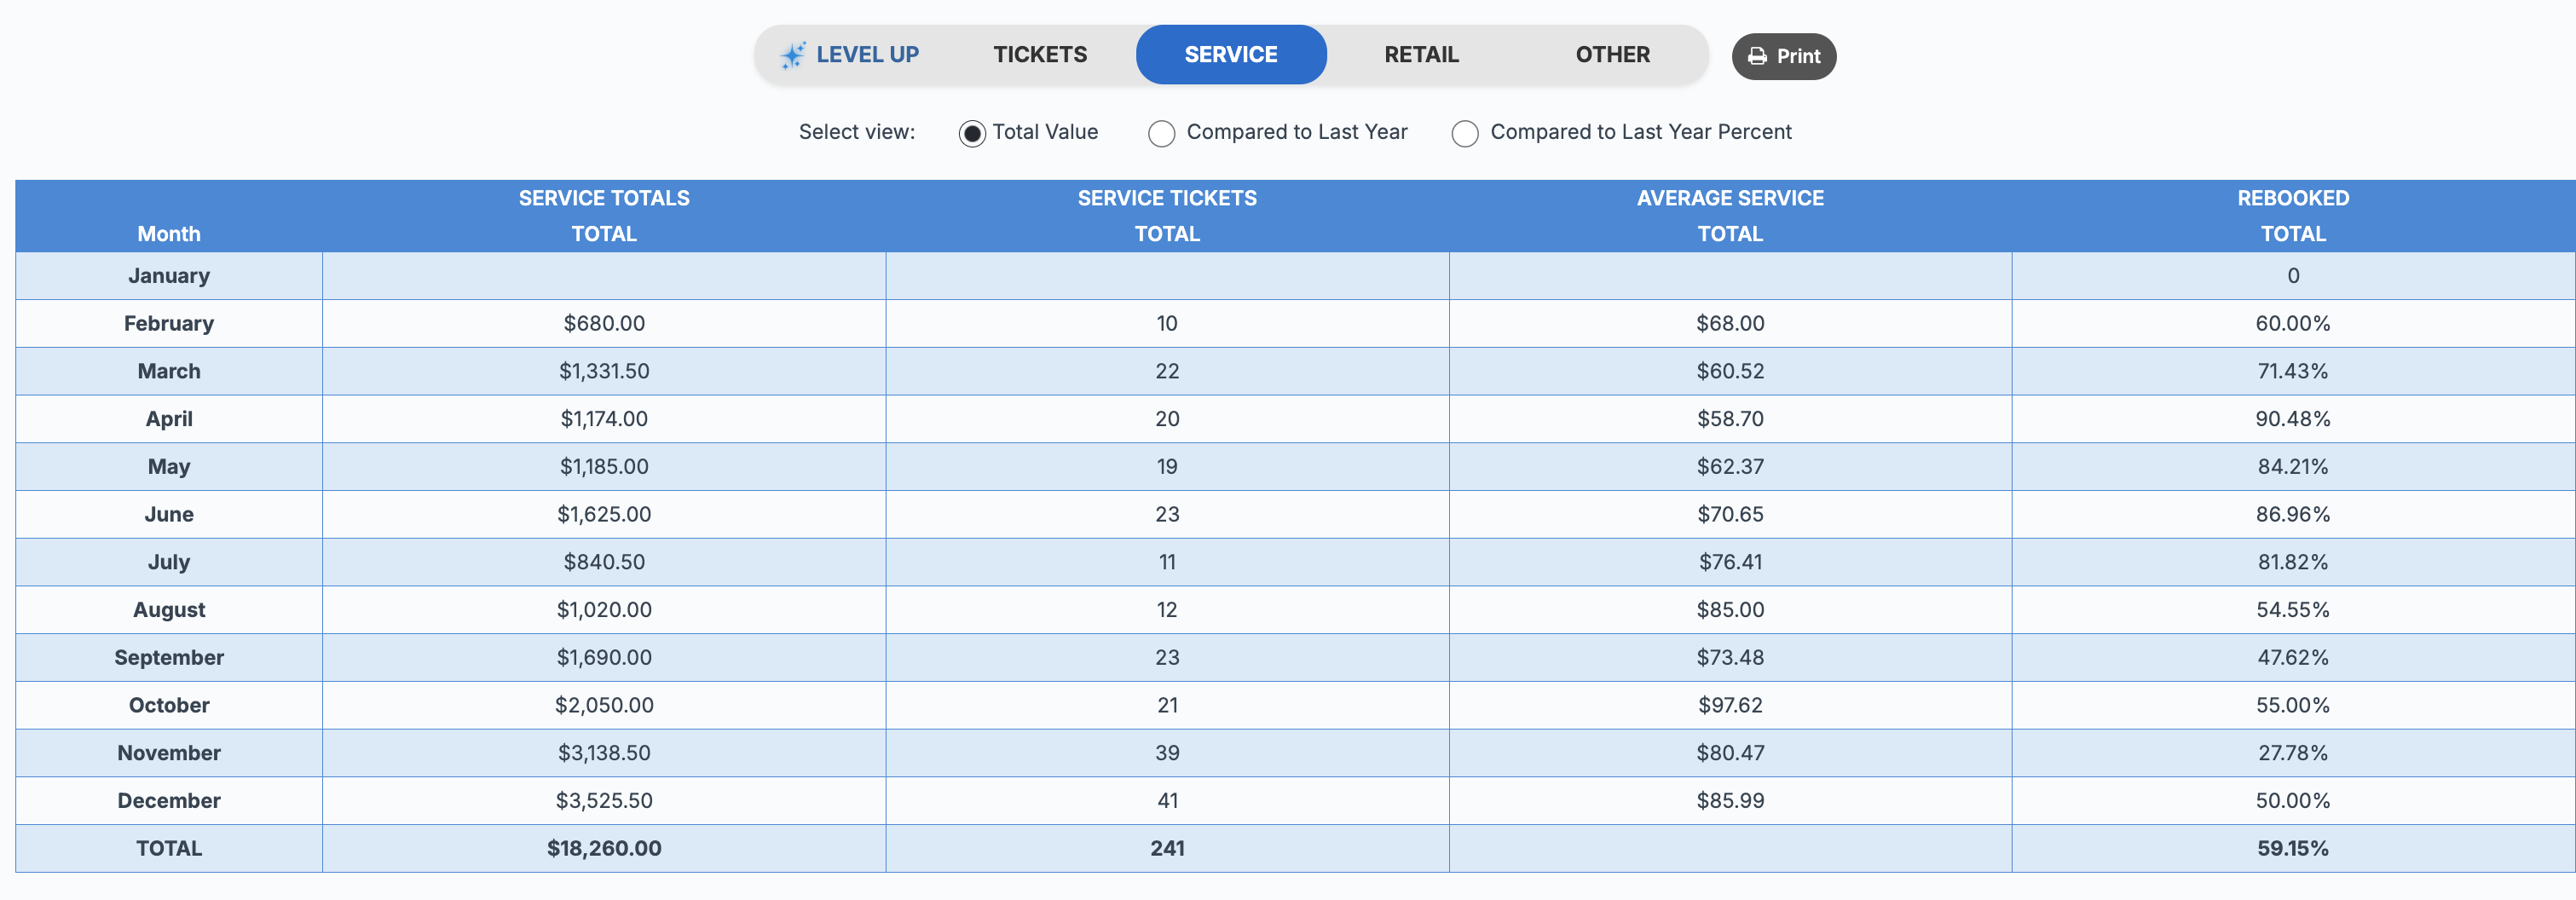
- Service Total – Total service revenue (excluding NCP values and tax)
- Service Ticket Count – Total number of service tickets
- Average Service – Service Total ÷ Service Ticket Count
- Rebook % – Percentage of clients who were rebooked
A Total row will appear at the bottom of each column to summarize the results.Be Inspired Services + Guest Charge does not always match the Total Sheet.
This is because Be Inspire totals do not include:
Refunded services
Deducted guest charges
The Total Sheet does include these adjustments.
This is because Be Inspire totals do not include:
Refunded services
Deducted guest charges
The Total Sheet does include these adjustments.
Products Tab 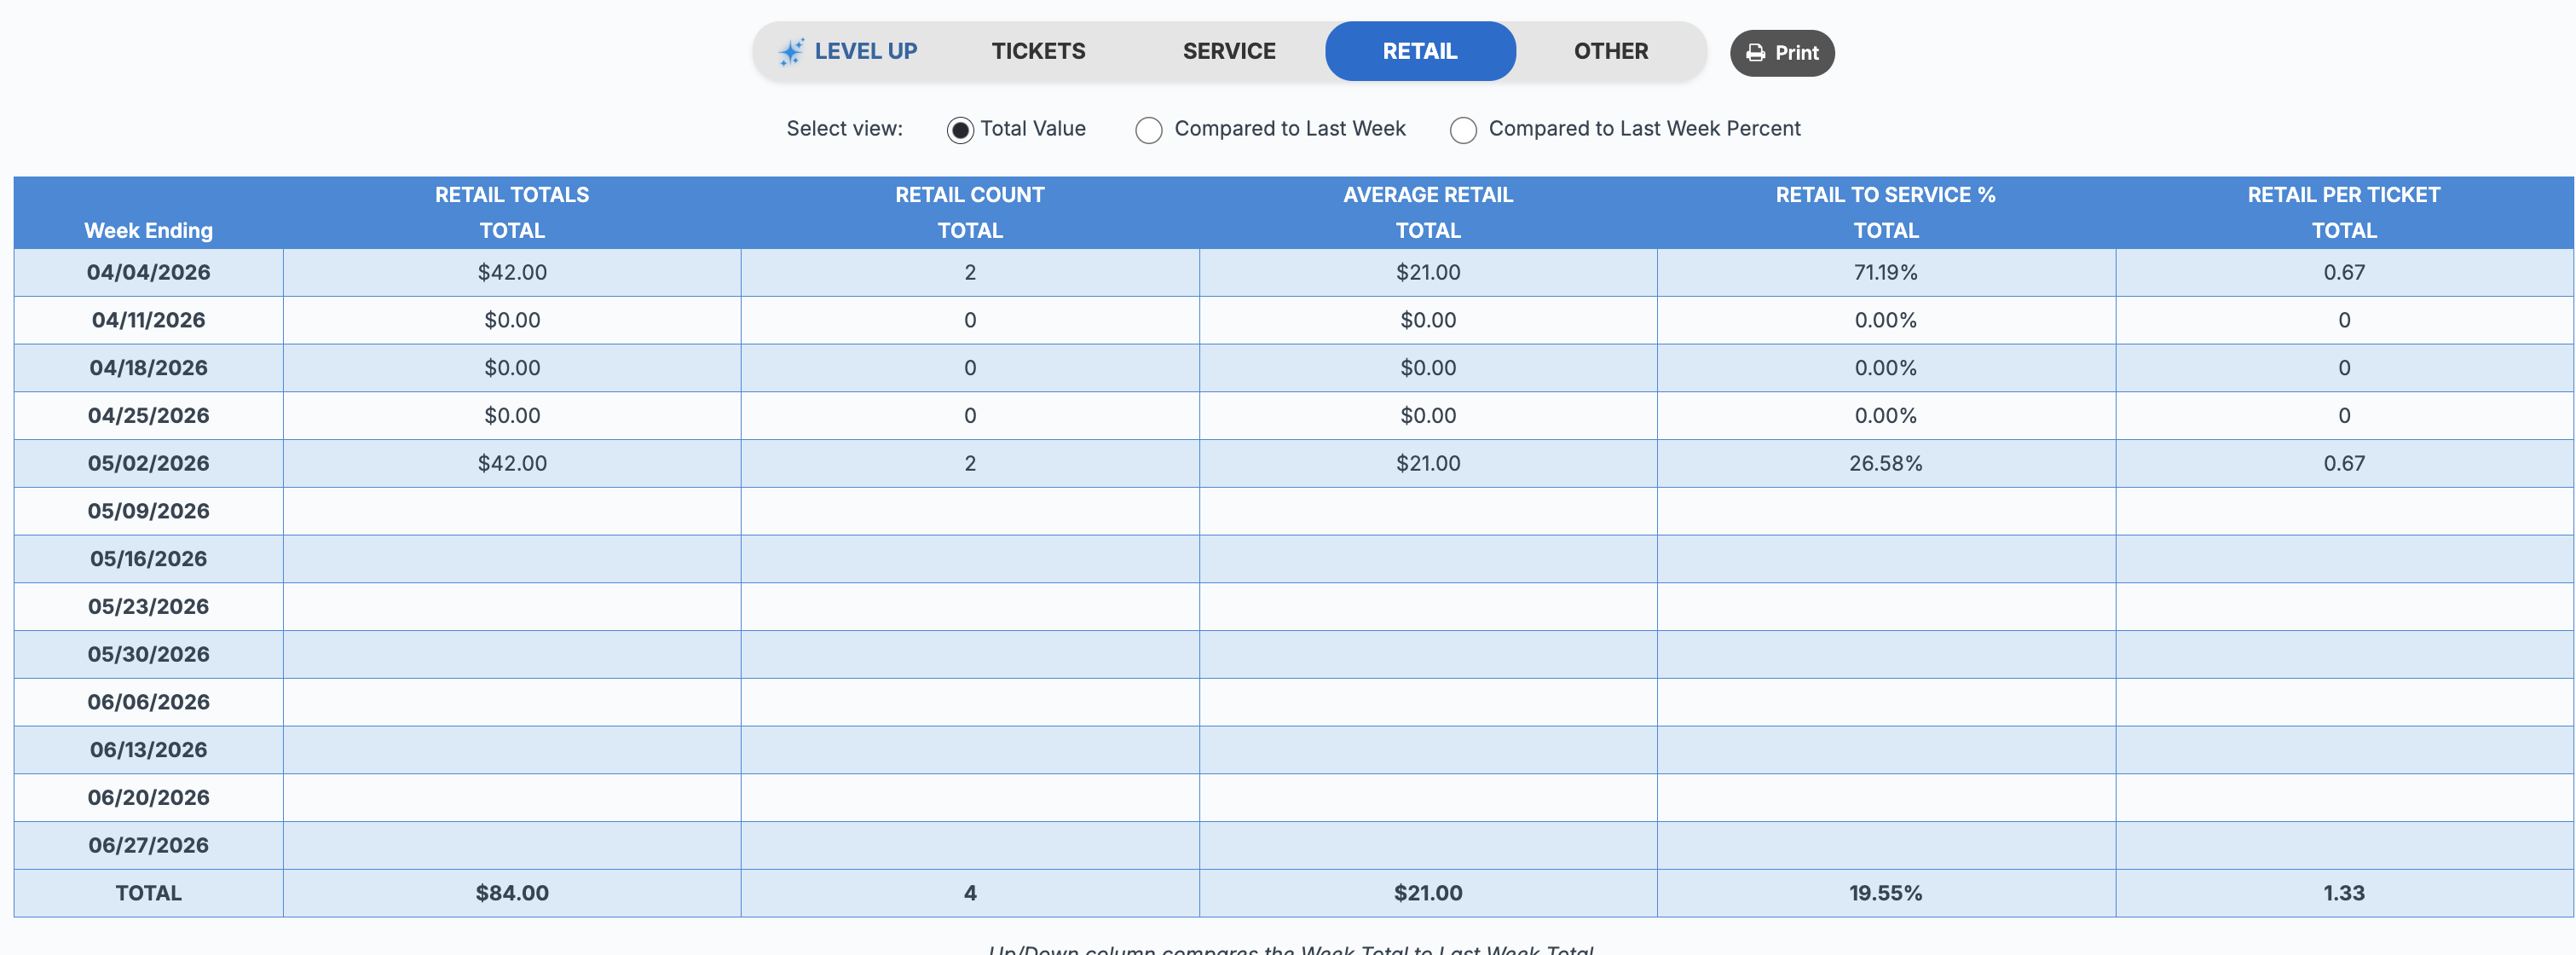 .
. 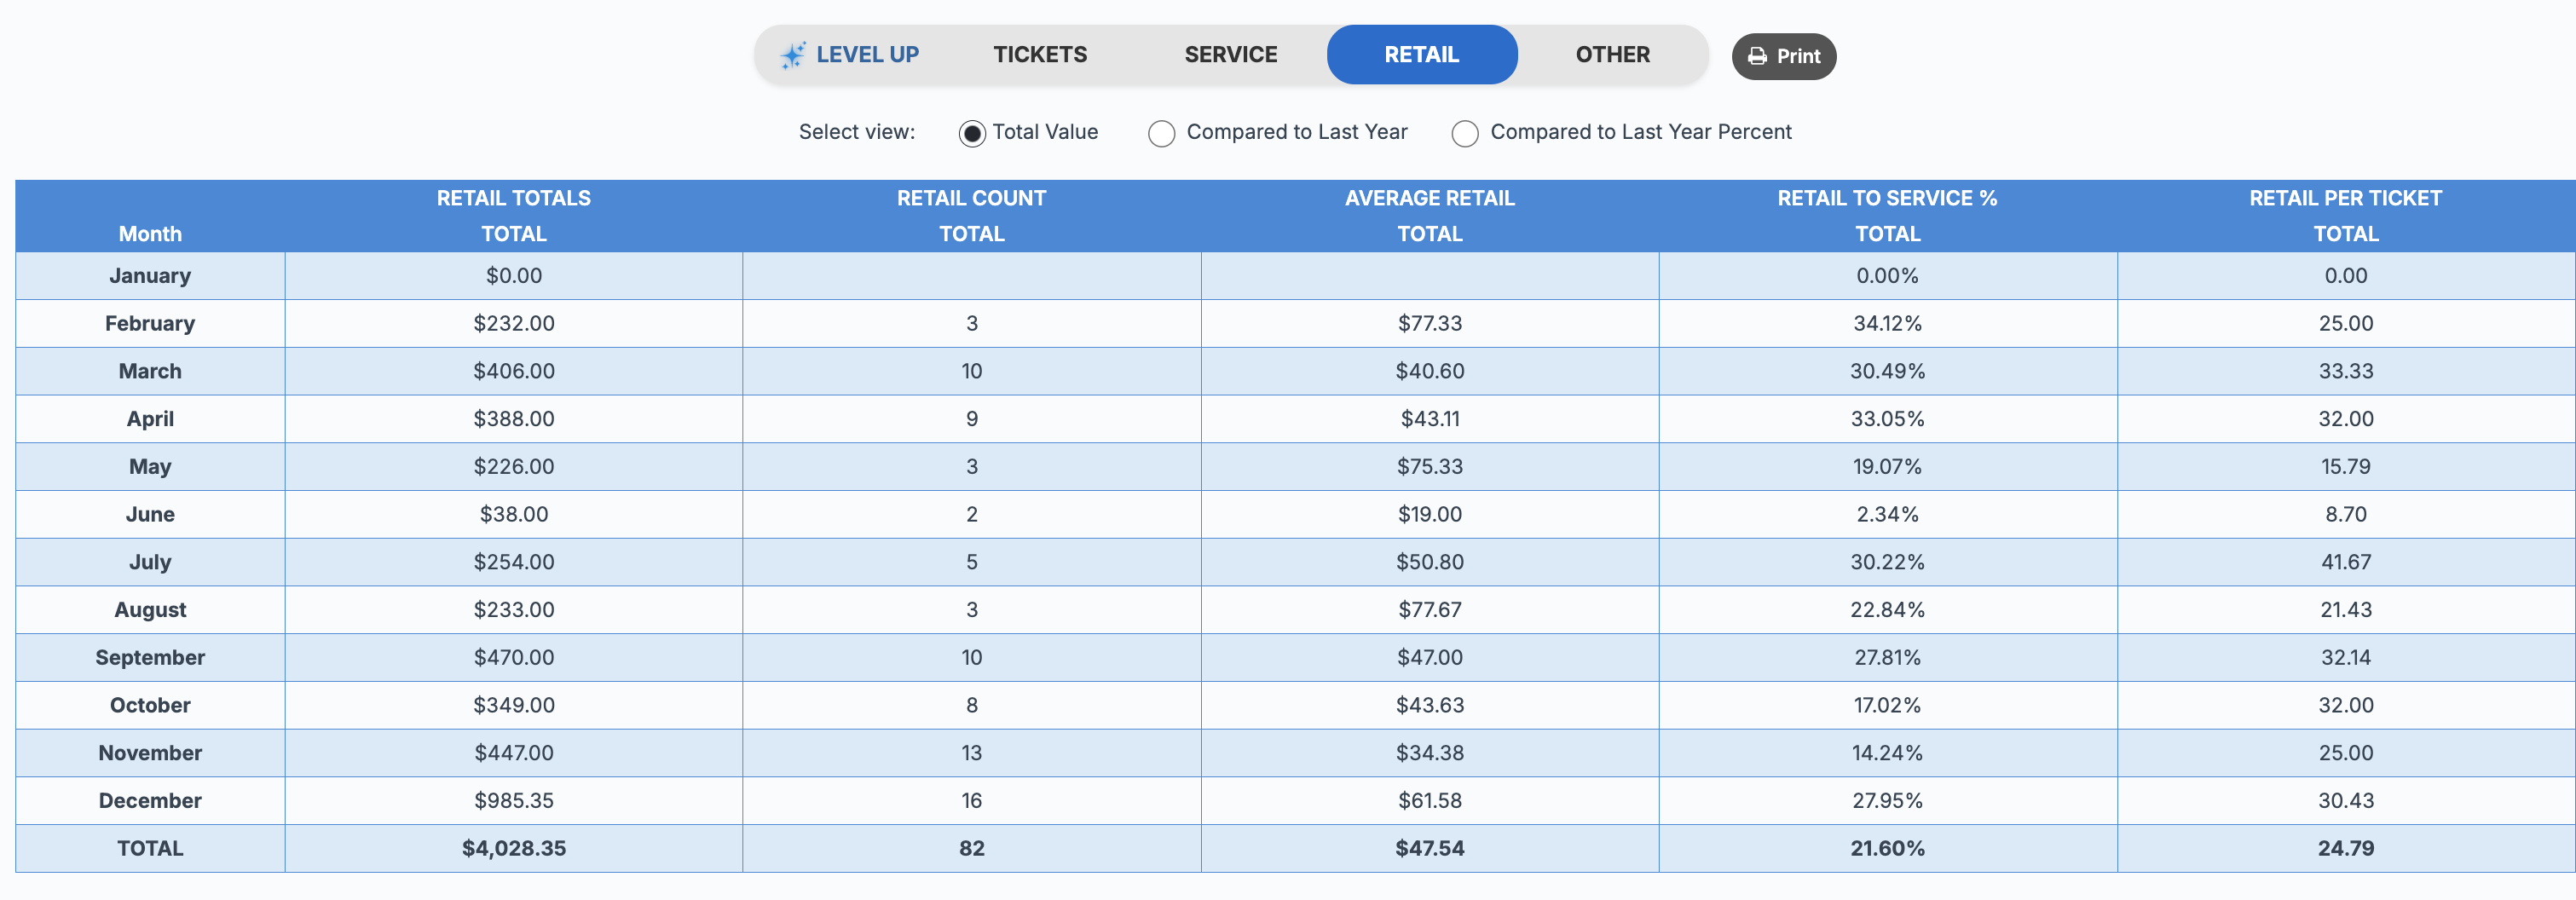
- Retail Total – Total product revenue (excluding NCP values and tax)
- Retail Count – Total number of product tickets
- Average Ticket – Retail Total ÷ Retail Count
- Retail per Client – Retail Count ÷ Ticket Count
- Retail to Service % – Retail Total ÷ Service Total
A Total row will appear at the bottom of each column to summarize the results.Other Tab – Company View 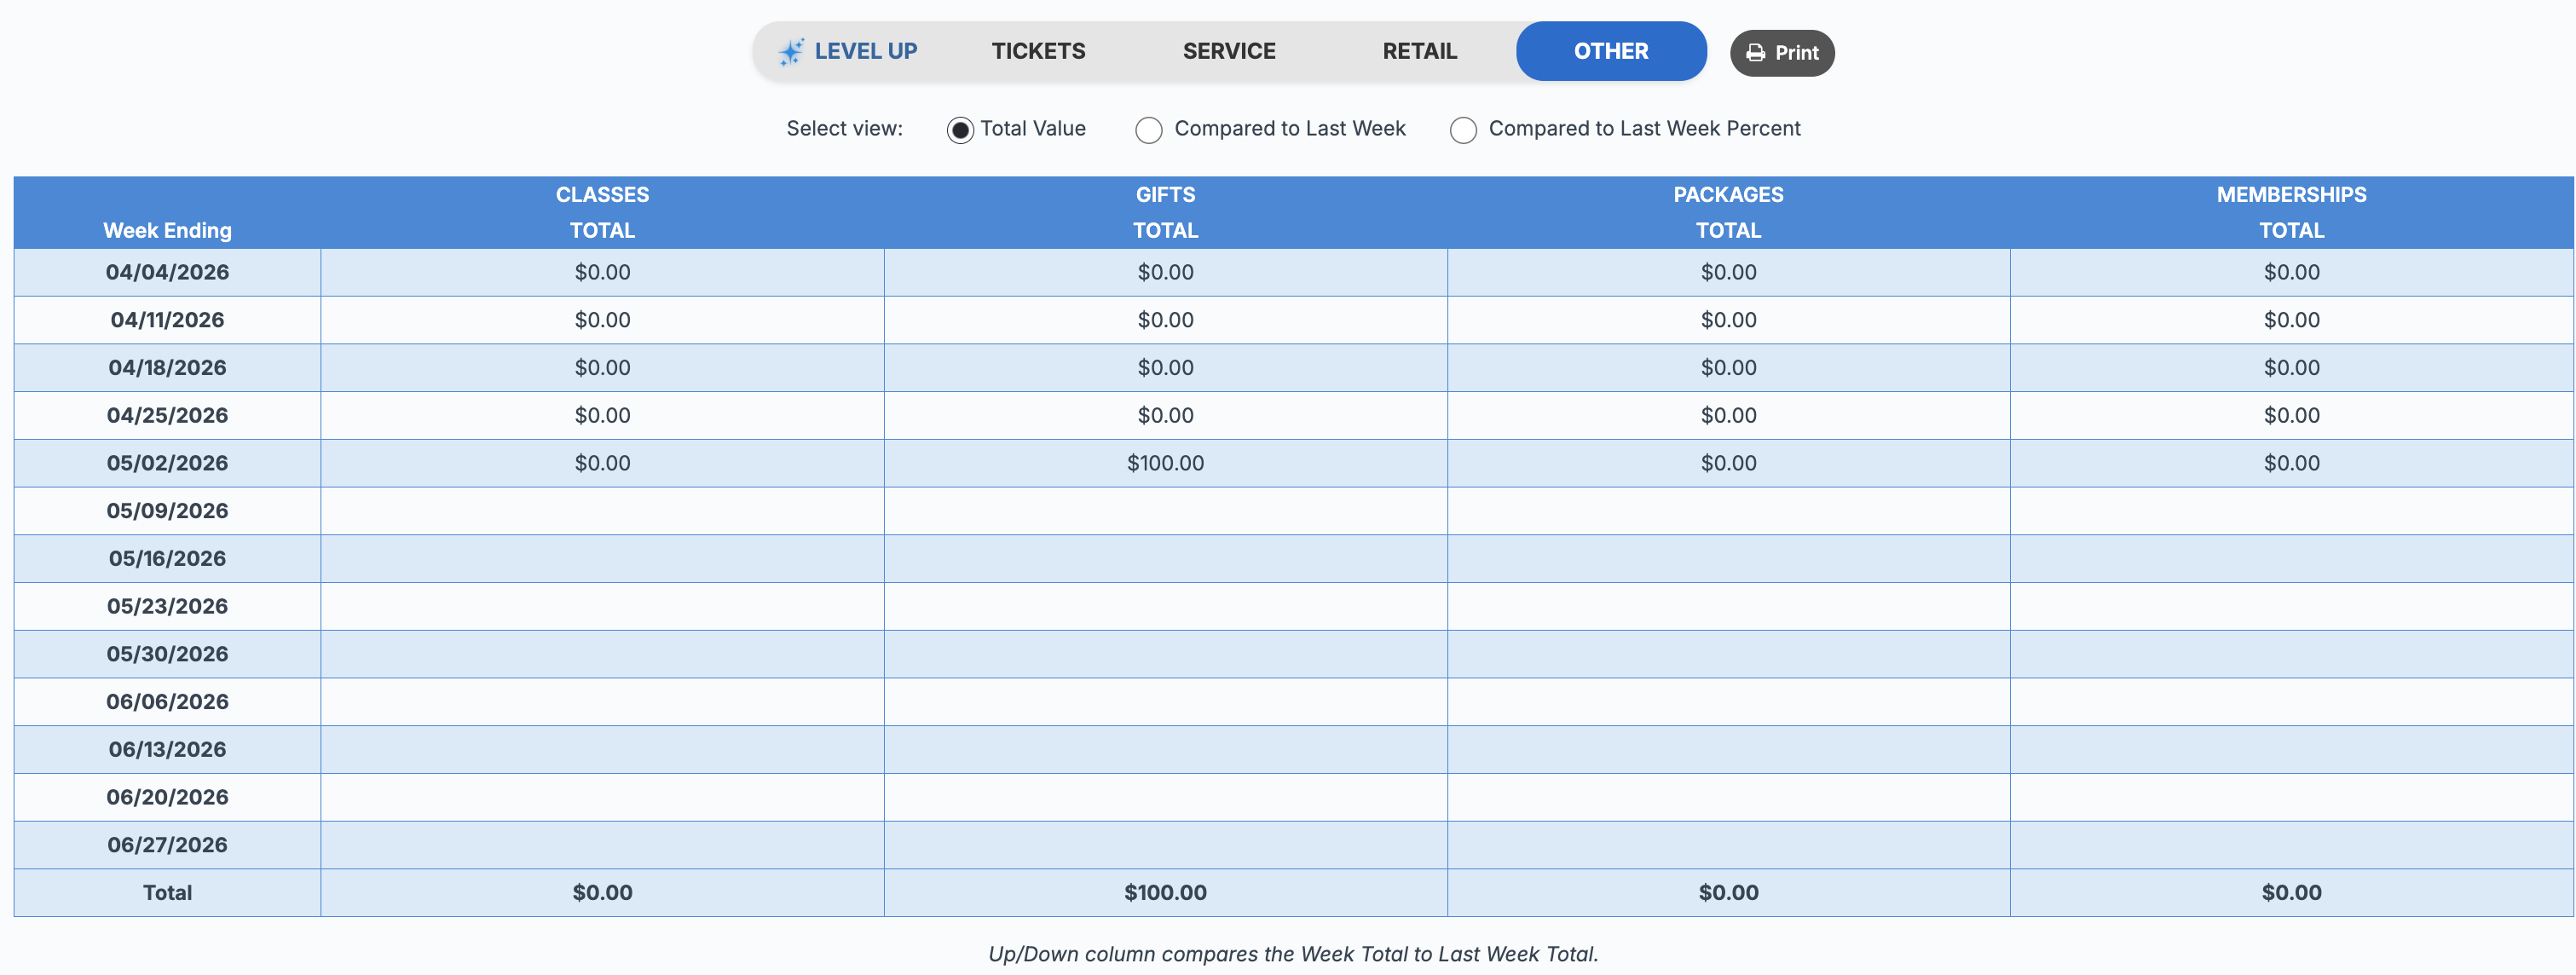 .
. 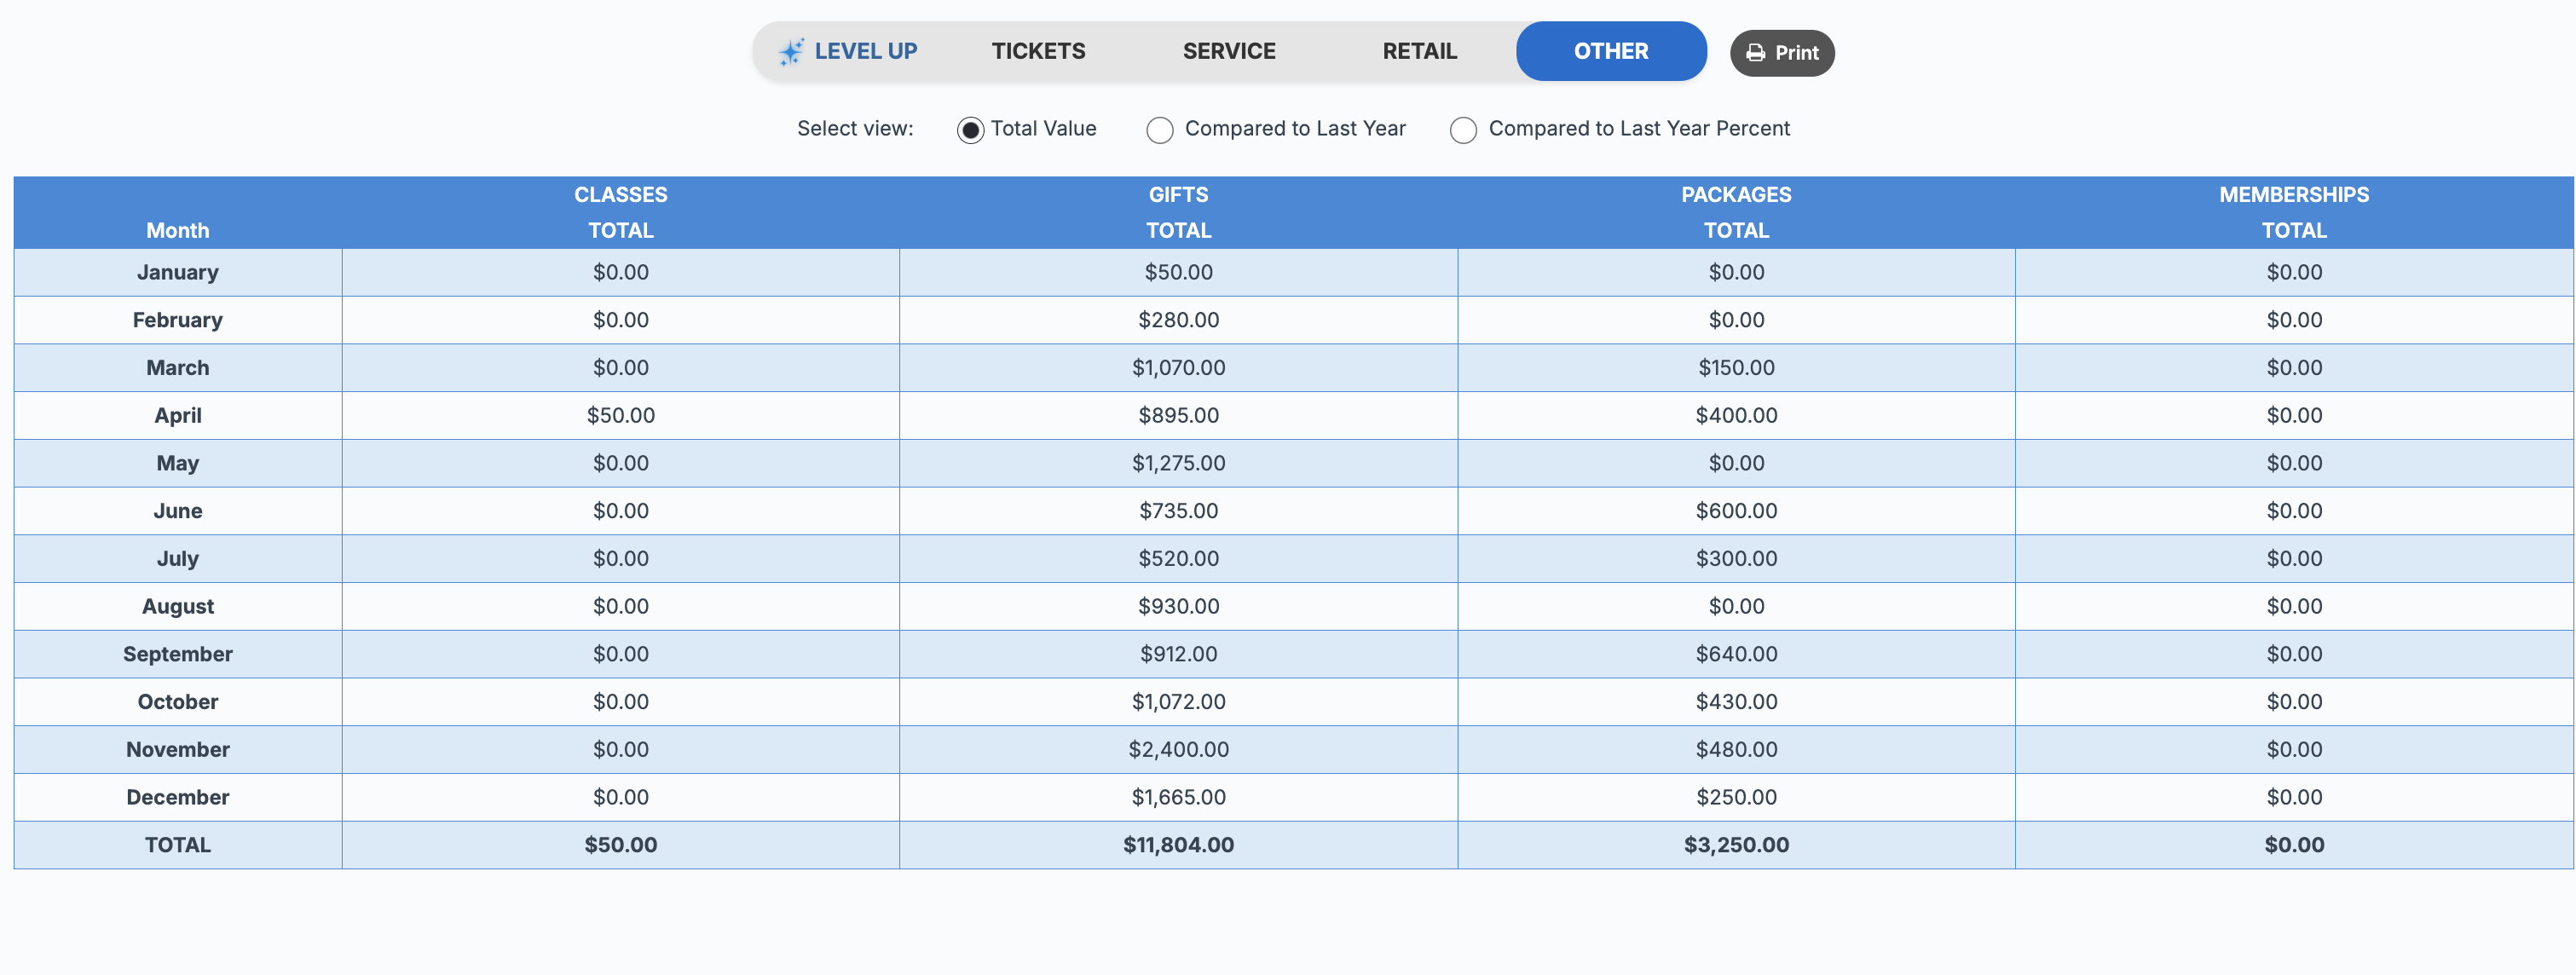
- Classes – Total sales from classes
- Gifts – Total sales from gift items
- Packages – Total sales from packages
- Memberships – Total sales from memberships
A Total row will appear at the bottom of each column to summarize the results.
Other Tab – Worker View  .
. 
- Classes – Total sales from classes
- Gifts – Total sales from gift items
- Tips – Total tips received
- Refunds – Total value of refunded services and products
A Total row will appear at the bottom of each column to summarize the results.
Additional Notes
- All totals exclude NCP values and tax unless otherwise specified
- All calculations are based on the selected timeframe and report filters
- This report is ideal for tracking performance trends, setting goals, and measuring progress over time
Related Articles
Refund Report
Location: Reports > Transaction Reports The Refund Report provides a detailed view of all refunded tickets, including information on whether products were restocked or if refunds were deducted from a worker’s compensation. This report can be exported ...Large Report Generation
When the following reports are selected to be generated for longer than one month, the software will require the report to be scheduled: Total Sheet Sales Analysis Report Text Count Report The report can be scheduled to run ASAP or you can have it ...How do I schedule a report?
This feature will be available in May 2024. Scheduling Reports is available on the following reports: Total Sheet Sales Analysis Report Text Count Report Yearly Dashboard Tab On Hand Product To schedule a report, go to one of the reports listed and ...Credit Card Batch Report
Location: Reports > Transaction Reports The Credit Card Batch Report exclusively reports on transactions where the payment used STX Payments integrated credit card processing. The report focuses on a single day's transactions starting at 9:30 PM EDT ...Referral Report
Location: Reports > Appointment & Client Reports This report shows a list of clients who were referred during a selected date range. You can also export or print this report for easy sharing or record-keeping. How to Generate the Report Enter the ...